
Quarterly Strategic Review - 3rd Quarter (Jul-Sep, 2026)
I’ve certainly used the pothole reference before to describe market challenges and there have been more than a few potholes that developed in the recent quarter. Like on a real street, some potholes can develop into sink holes and cause flat tires and for those of us that have had a flat tire, rule number one is to stop driving on it or you’ll end up wrecking your rim.
To turn to our investment portfolios, it’s been bumpy in recent months, when July marked the worst month in many years (not even sure how many!). It’s fair to say that when unusual things happen, just like experiencing car trouble, we head into the shop and take the time to dig in deeper to see if the mechanics are ok. Our investment process is always evolving and it has to be. Markets are always changing and new risks and opportunities regularly present themselves. As July was coming to an end, learning about the “ Situational Awareness” fund’s failure helped explain some of the unusual market moves. You know me, I don’t like to use the narrative toinvest and prefer taking price’s lead (and this time was no different), but after the fact, to learn of the massive unwind in many of the artificial intelligence stocks being caused by a large, over-leveraged player failing made sense.
Artificial -> Super Intelligence, Oil Shocks, Earnings Strength + Telecom Battleground
I’m pretty sure we’ve all heard of artificial intelligence now, but guessing there are a few of you that have not yet tried it beyond perhaps a search or two. It’s pretty wild what is going on and it’s creating some significant demand for power, chips and memory as companies scramble to solve the shortage of compute faced. Here’s some key stats that you likely aren’t aware of:
- Massive power shortage as the U.S. by 2050 is expected to be about 6 California’s worth of power short
- Amazon AWS ordered 1 million+ Nvidia GPUs in ’26 plus 2 million more for ‘27/’28
- GE Vernova: 116GW turbine backlog that’s mostly sold through 2030
- Texas announces a large-load freeze as demand surges beyond reason
- Anthropic (Claude) revenue $16.8 billion for Q3, up +45% q/q
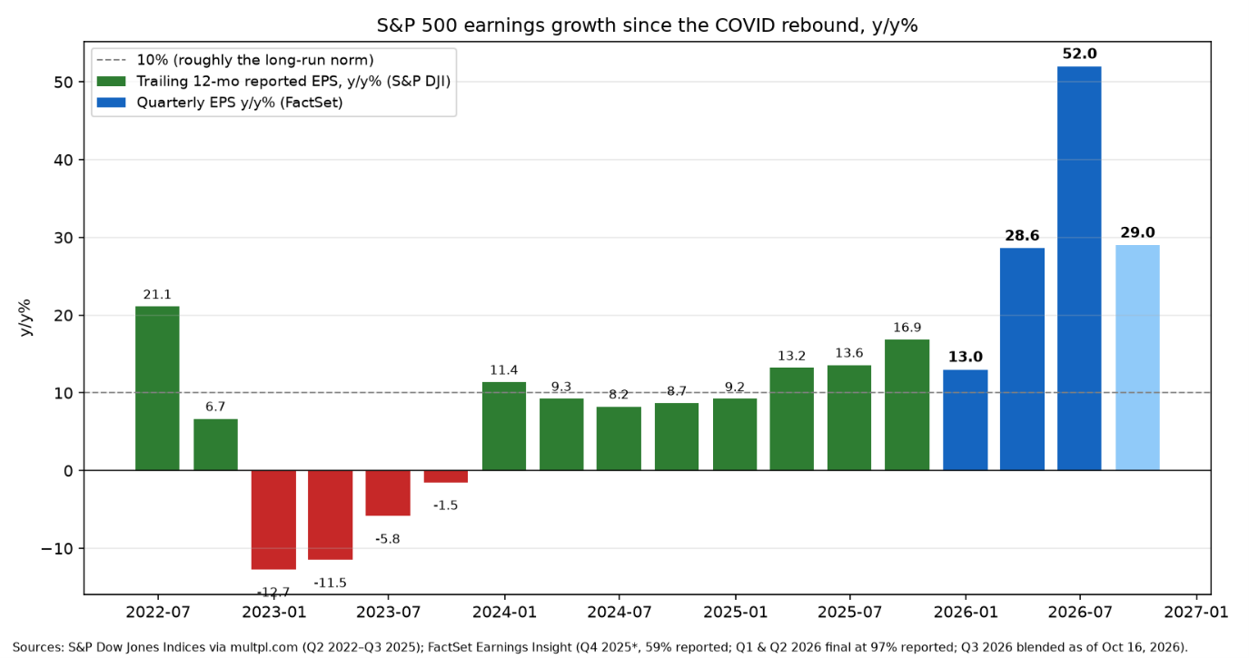
Officially, it’s being termed an “oil shock”, which refers to the increased price of oil this year (~$99/barrel) and since the start of the attack on Iran in late February. That said, oil is still well below (~-23%) the price per barrel that it was in 2022. Has the Financially INsync | Raymond James Ltd. Unit 1 – 595 Parkside Drive | Waterloo, ON | N2L 0C7 519.883.6031 519.883.6050 market cared? I think the reason it’s appeared to overlook such a shift in the inflationary impact of oil and economic disruption that would typically follow is because earnings have been strong, in fact, very strong.
We’ve just had two confirmed quarters above +25%, with Q3 on track for a third and that would make the eighth straight quarter in double digits! Wow!
One of the most important market developments of the past quarter has been the sharp rise in long-term bond yields. This adds a huge cost to all borrowers and for the first time in years, we’re seeing a country, in this case France, acknowledge the rising borrowing costs and attempt to announce austerity (which has resulted in some awful looking violence and looting behaviour!). Any group of individuals or organizations that sees their government funding cut is never impressed and yet what are the governments to do? The reality is spending beyond your means has consequences!
Another large event that I think is worthy of note is the significant weakness we’ve seen in the telecommunication stocks like Telus, BCE & Rogers … firstly, these are typically considered “dividend stocks” which means investors want their dividends, but as competing yields on GICs (and CDs in the U.S.) increase, these dividend yields aren’t sufficient to compensate for the risks. And here comes Starlink. Have you used it yet? I recently had trouble getting the wifi to work well on an Air Canada flight home from the U.K., and they confirmed that Air Canada had already made the decision to switch (soon I hope!) to Starlink. Their services and business objectives to provide high speed, and very little delay internet everywhere on earth is bold and even our local companies today use Starlink to help their customers have continuity when roaming afar and needing reliable access in rural and remote areas.
AllINsync (RJI237)
Choosing an investment is only part of the job. We also need to decide how much to own. A stock with larger price swings generally needs a smaller place in the portfolio so that it does not have an outside effect on results.
Suppose a stock makes up 10% of your portfolio. If that stock falls 2%, it would reduce the portfolio’s value by 0.2% assuming everything else stays unchanged. A stock that moves more sharply could have a larger effect, so we would generally hold less of it.
Want more detail? At the end of this review, I’ll explain how we use each investment’s price movements to determine how much we can own.
Bottom line: We always want to be able to estimate the overall risk we’re carrying and compare that regularly to the market. As July started, we were carrying ~35-40% more risk than the market. On the one hand, as trend followers, that’s what we want meaning we’re letting the stocks run and do their work adding value to our portfolio, but when a big price shock hits (July was all that and more!), we were subject to more downside volatility than I would have preferred (speaking for at least myself here!).
We’re continuing to work on the definitions that guide the amount of exposure that we want to take for the portfolio depending on the type of market condition/regime that we’re dealing with. This was a repeated topic among fellow practitioners at both the CMT Summit in Bethesda, MD and the IFTA conferences in London, UK in October that I attended. More to come…
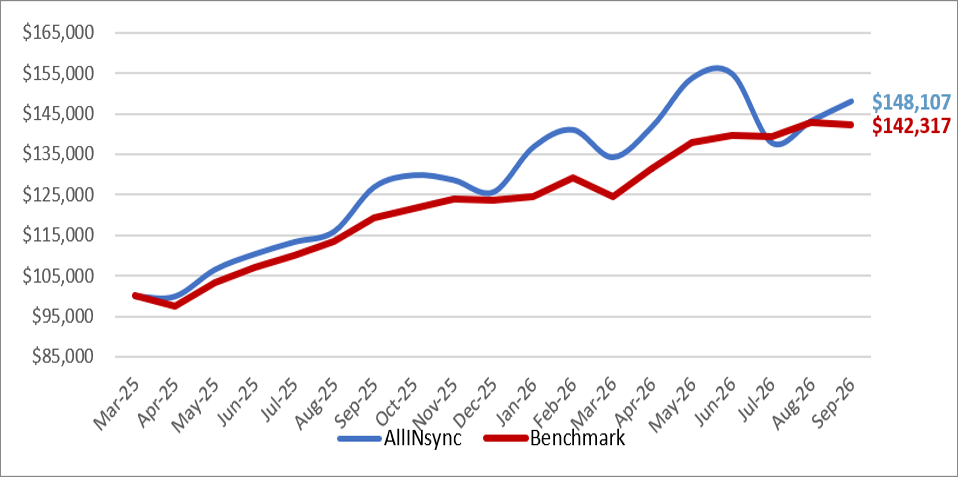
Here’s the updated chart of AllINsync vs. our 50/50 benchmark since March 31st, 2025 (after the initial rebalancing period) to the quarter-ended September 30th, 2026. The blue line is AllINsync vs. the 50/50 benchmark is red.
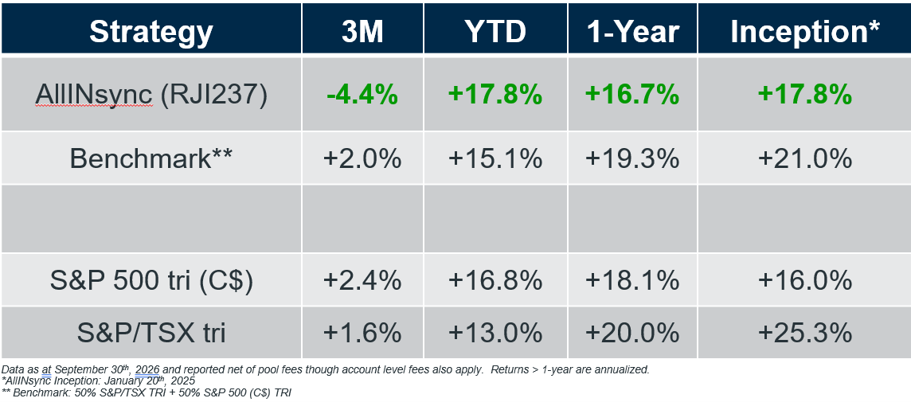
And here is the table of returns, also through September 30th, 2026 quarter end.
Our Strategy & Our Allocation
As I write this, it’s mid-October and it seems outdated to only speak through September 30th, so I’m writing in the current tense.
While October has the worst reputation as being a volatile challenging month, it’s actually September that tends to offer lower average returns, but more to the point, October has tended to offer lots of intra-month volatility with many big market selloffs in October. Think 1929, Black Monday in 1987, 2008 and 2018 and on right on cue, we’ve just had a weak run for technology stocks which represent a rather large ~38.4% weighting in the S&P 500.
After my weekend chart review, I can admit that there are a number of peaks that have seemingly taken place (including stocks that we used to own) and given we never know whether a short-term peak will become an intermediate-term peak or go on to become a long-term peak, as usual, we de-risk as we go to adjust by taking profits and/or cutting losses.
The energy sector has been robust and outperforming the broad markets though in more volatile fashion And we’re sitting in #AllINsync with approximately ~13% exposure via Cenovus ($CVE) & Suncor ($SU) along with some indirect exposure from our ETFs. Outside of #AllINsync, clients also own some Imperial Oil ($IMO).
Some of you know (or perhaps remember) what “INvertigo” and/or “ETF 6/16” are – as of this month, both of these strategies are no longer being run on their own despite having done so for the past 6+ years. Why? Well, when #AllINsync was developed, it was designed and implemented to be just that, “all” INsync. Each of the originally designed strategies related to trend-following, ETFs and breakouts (INvertigo) are now combined into the “AllINsync” fund that we keep talking about (and most of us own). On the one hand, it feels like the end of an era to me, and as a data junkie, it’s something I had to get over, but the bottom line is that we need each of our accounts to be acting for the greater purpose which is to go up in a riskadjusted way, from the lower left to the upper right.
Since the time we’ve been at Raymond James (almost 4-years now) and frankly, since INvertigo incepted on January 1, 2020, it’s been a VERY erratic and a highly variable strategy. Out of market bottoms as stocks break upwards like in 2020 after COVID or in 2023 after the bear market ended it can be exciting and worked well, but continuing in all environments just cannot be justified. Its risk and return profile has not offered what I’d expect of them, and so that’s that. Onwards.
A Few Reminders & Closing Thoughts
I am sincerely looking forward to a quieter fall as 2026 winds down. I’m always amazed at how quickly time goes and how fast the kids grow up, but I’m not aware of any solution to slowing that down. We’re all getting older and remembering to make time for our families, our loved ones and for us to of course make time for you, our valued clients, is of the utmost importance.
Your questions, comments and/or feedback (good or otherwise!) is always welcomed!
Sincerly,
David Cox, CFA, CMT, FMA, FCSI, BMath
Senior Portfolio Manager, Wealth Advisor
Raymond James Ltd.
Phone: 519.883.6031
Unit 1 – 595 Parkside Drive | Waterloo, ON | N2L 0C7
david.cox@raymondjames.ca
www.financiallyinsync.com  @DavidCoxRJ
A Closer Look: How We Decide How Much to Own
Optional reading for those interested in the numbers behind our approach:
Apple ($AAPL)
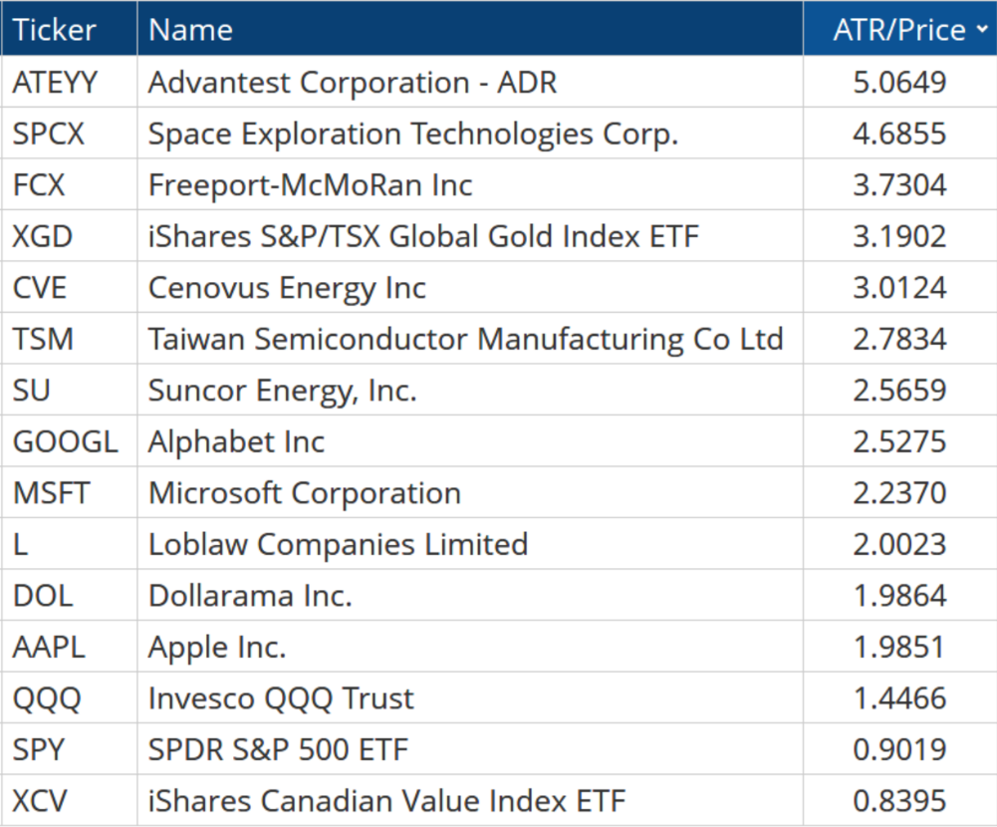
DC ATR = 2.0% (our risk assumption – on a typical day, $AAPL stock moves +/- 2%)
Therefore, if we buy:
3% position -> we’d expect 3% * 2% = .06% (6bps) of risk to the portfolio
5% position -> 5% * 2% = .10% of risk to the portfolio
10% position -> 10% * 2% = .20% of risk to the portfolio
All things being equal if Apple stock had a tough (typical) day, and we had a 10% position, our portfolio would lose -0.2% from that position alone. Now let’s contrast that with SpaceX ($SPCX).
DC ATR = 4.7% (on a typical day the stock moves +/-4.7%)
That makes SpaceX about 135% more risky than Apple for an equal position. And copying the Apple example, if we had:
10% position in $SPCX -> 10% * 4.7% = .47% meaning that if the stock fell (its typical amount), our portfolio would lose almost half a percent from that stock alone.
Keep in mind that on negative market days, most stocks fall and so we’d lose on other positions too. Right now, I’m comfortable saying that a max-weighted position should bring about 0.25% of risk to the portfolio.
That means if we owned a maximum size position in either of those stocks:
Apple could be 12.3% (we have other constraints that would cap us at 10% though!) and SpaceX could be 5.3%. If they were sized in that manner, both would bring equivalent risk to the portfolio and form a volatility-adjusted position sizing mechanism.
Some of you are falling asleep (sorry!) but for those still wide-eyed, here are the “DC ATRs” for our individual stocks & ETFs:
Disclaimer: Information in this article is from sources believed to be reliable, however, we cannot represent that it is accurate or complete. It is provided as a general source of information and should not be considered personal investment advice or solicitation to buy or sell securities. The views are those of the author, Financially INsync Team, and not necessarily those of Raymond James Ltd. Investors considering any investment should consult with their Investment Advisor to ensure that it is suitable for the investor’s circumstances and risk tolerance before making any investment decision. Statistics, factual data and other information are from sources believed to be reliable, but accuracy cannot be guaranteed. It is furnished on the basis and understanding that Raymond James Ltd. is to be under no liability whatsoever in respect thereof. It is for information purposes only and is not to be construed as an offer or solicitation for the sale or purchase of securities. Raymond James Ltd. is a Member Canadian Investor Protection Fund.
Raymond James (USA) Ltd. (RJLU) advisors may only conduct business with residents of the states and/or jurisdictions for which they are properly registered. Raymond James (USA) Ltd., member FINRA/SIPC.