Monthly INsync Chit Chat March 2024
Such a Different World [by David Cox]
More than 20 years ago, we had travelled to Africa and across vast lands into different cultures and I think it’s fair to say that Dubai no doubt stands out as an equally unparalleled journey. Unlike my fellow passengers on the dark plane, I opted to largely stay awake for the flight and arrived eyes wide open into a glitzy, classy airport full of smiles and service and a city architecture so uniquely built to catch my attention.
Swimming in the Persian Gulf was amazing on a hot summer day (they call it winter here, but 25 degrees was hot to me), drinking a banana juice with my biryani and seeing live music at a shisha bar too was such a rich cultural opportunity. But today, I had a local, guided tour of “Old” Dubai, the gold and spice souks along with a variety of other tastes and smells of the local culture. The conference started tonight, and tomorrow it’s on to the Museum of the Future for a host of great presentations and an opportunity to meet fellow technicians from around the world, though seemingly many more from the Middle East this year given the new twist on the locale. Excited! My presentation is entitled “Manual Art of Technical Analysis vs. Quant Automation”.

News –Some That You’ve Heard, Most That You Haven’t [by David Cox]
The Federal government (Liberals) are now seeing a number of lawsuits filed after it was ruled their response to freeze bank accounts and enact the Emergency Act were deemed illegal (more taxpayer costs coming!). The DoJ finds that while Biden indeed illegally stored classified documents (just like his rival), he’s unfit to be charged and deemed to be old and senile. Tucker Carlson’s interview of Russian President Vladimir Putin had more views than all other media combined. French parliament passes a new law whereby anyone speaking out against the “accepted view” (which is what the government says) is now subject to a three-year jail term and 48,000 Euro fine (watch for these totalitarian laws coming to a country near you soon). Deep discounts appear in commercial property in the U.S. and Canada’s own pension plan seeks to reduce exposure to real estate by selling a redevelopment project in Manhattan for only a single $1. British embalmers warned to not report anything about the fibrous stuff found in those who die suddenly. New program in NYC will see illegal migrants receive a $10,000 credit card that can be used for expenses at their own discretion.
Things We Recommend [by David Cox]
As odd as it might seem, I’d like to recommend the simple, available and everywhere fresh air that surrounds us. With such access to devices and gadgets and a whole gamut of distractions in life, the simple pleasures gained from a trip outside cannot be minimized. Some of you know that I made it an objective of mine this year to get out for 365 walks and while some of those walks have no doubt been short 7-8 minute trips around town, others have been more lengthy, but all share the same value to me, and I’d like to suggest to you. To spend time without a phone in our hands, to listen to the sounds of the cities, or towns, or countryside we live in, is something that I suspect many of us take for granted. But breathing deeply outside, stretching the legs, keeping the blood flowing is an activity that most of us can tackle, if we choose. I know we have no shortage of excuses we can concoct and we’re afraid to miss the upcoming show on TV, or the Facebook post, but we all need balance. I’m writing this on my all-night flight and I’ll tell you that I’m looking forward to arriving in Dubai later, and wandering around, if only for a glimpse of what this far away land offers.
Lifestyles To Consider! [by Criselle Tung]
Tax season is here, and it can feel overwhelming, but with a few lifestyle adjustments, we can look to navigate it more smoothly. Instead of scrambling at this time of year, consider this advice to make this annual exercise easier.
Firstly, keep your documents organized regularly. Designate a binder for storing necessary paperwork including receipts, income statements, tax forms (old ones and current ones) and your notice of assessments. Make sure to do this throughout the year and not just leave everything until the last minute. This will simplify the document gathering process needed to get this task underway.
Secondly, embrace the digital tools available to you. There are free software options such as TurboTax, Wealthsimple and/or H&R Block, which can simplify the process of information gathering, deduction calculation, and filing taxes online. These software programs also offer step-by-step guidance and automatic computations, which can save you time and reduce errors. You don’t need to be a tax expert to use them. However, if your tax situation is complex, don’t hesitate to seek help from a qualified tax professional or even ask us for ideas!
Lastly, stay informed about tax rules and pertinent changes. While learning about how much tax we owe (and pay!) isn’t always exciting, finding opportunities to lessen taxes can be! Ensure you maximize the benefits of tax credits and deductions to reduce your tax liability. It surely feels good to get some of our money back!
How’s the (Bigger Picture) Market? [by David Cox]
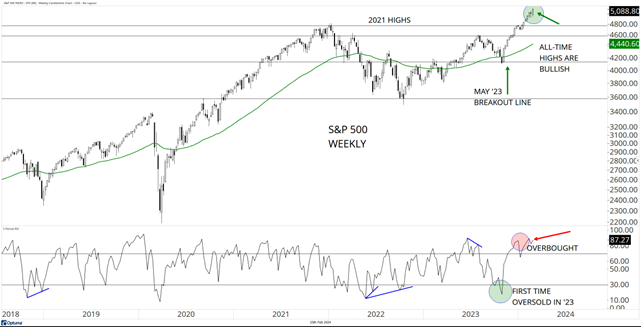
Although we always focus here on the U.S. market, I have to tell you that global equities are waking up, market by market and it’s not just a U.S. story. I know we can always find excuses, at least as investors, to feel concerned about what could happen, or to know that surely, the events taking place and the changes happening around us in this world cannot be sustainable. While that may be true, as investors, we have price as our guide. The simple analysis we can make of demand and supply and our goal is to stay on the right side. And the recent breakout to new highs continues to develop, and the breakout of world ex-U.S. equities has also taken place. When markets are rewarding risk-taking, investors need to seek and earn the reward, for it’s not always available to us.
Source: Optuma
* * as at February 23rd, 2024
Market Summary and Trend of “All Assets” [by David Cox]
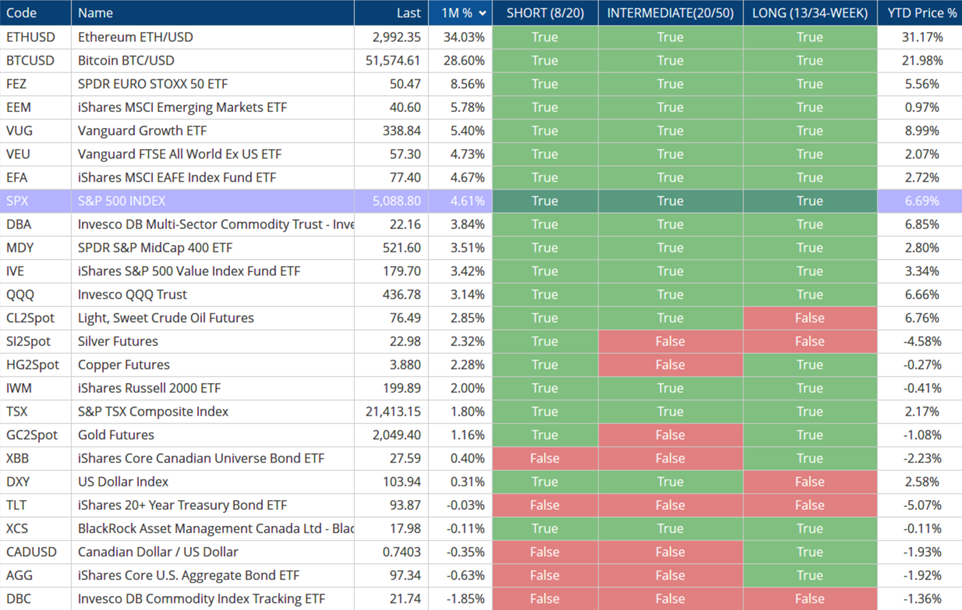
As we sort by one-month return, we can see it’s Ethereum (what’s that you ask?) and Bitcoin up the at the top of the list, again continuing on after a strong 2023 and moving forward. Demand into the new Bitcoin ETFs has been significant and less than two months since the launch and SEC approval, they’ve taken in approximately $7.7 billion capital. With more (and new demand) entering the space, the limited supply has given way to higher prices, as any simple student of economics would understand. We also see European equities, and emerging market equities up on the list and look at all that green? Short-, intermediate- and long-term trends are positive in many spots, save for commodities and bonds, but that shouldn’t bother us.
Source: Optuma
* * as at February 23rd, 2024
We All Need To Keep Learning! – “Understanding Market Breadth” [by Conor White]
Market breadth refers to the number of individual stocks that are participating in a market move. It provides investors with crucial information regarding the overall health and direction of the market beyond just looking at individual stock prices.
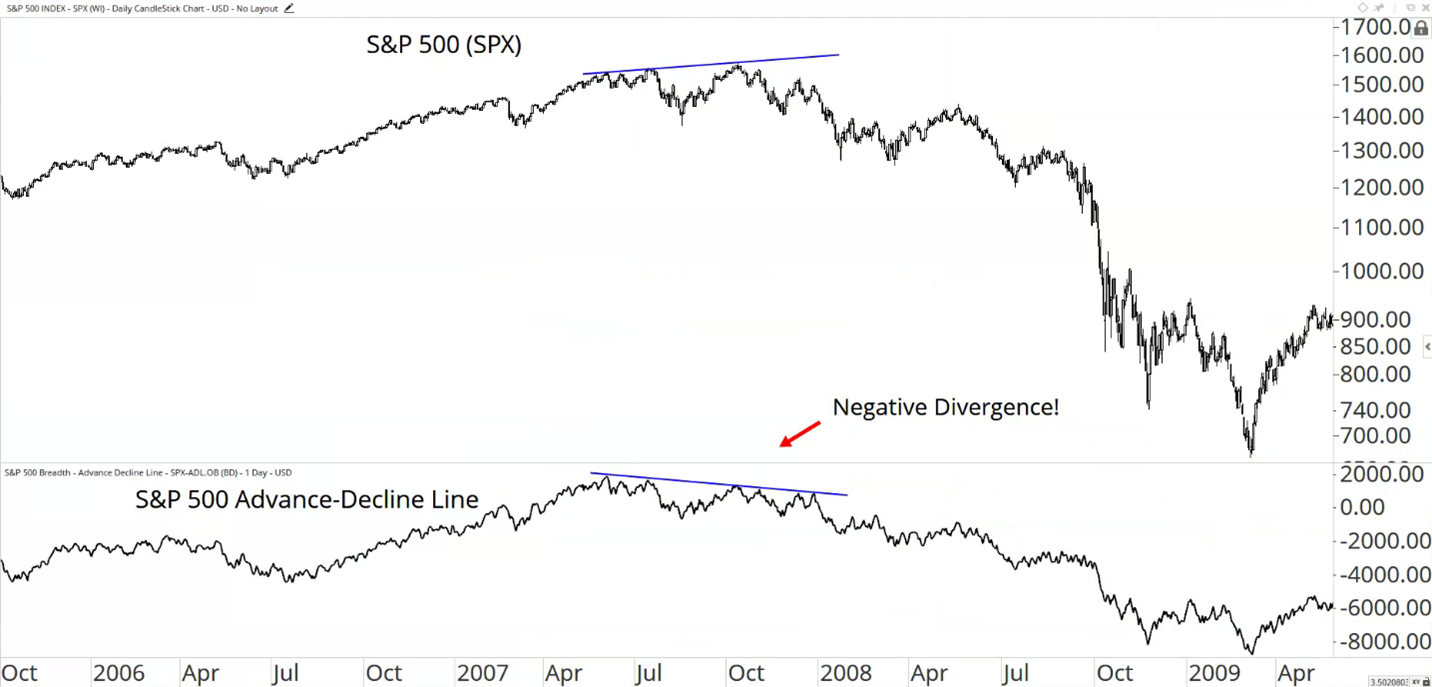
One common indicator of market breadth is the Advance-Decline Line (A/D line), which compares the number of advancing stocks to the number of declining stocks over a given period. The A/D line tells us whether the majority of stocks are participating in the direction of the index, and it can often signal a potential trend reversal.
For example, if the market is trending higher, but the A/D line is trending lower, then we have what is called a negative divergence. A negative divergence is a sign of underlying weakness in a market trend. An example of this happened leading into the 2007 highs, right before the crash in 2008.
Source: Optuma
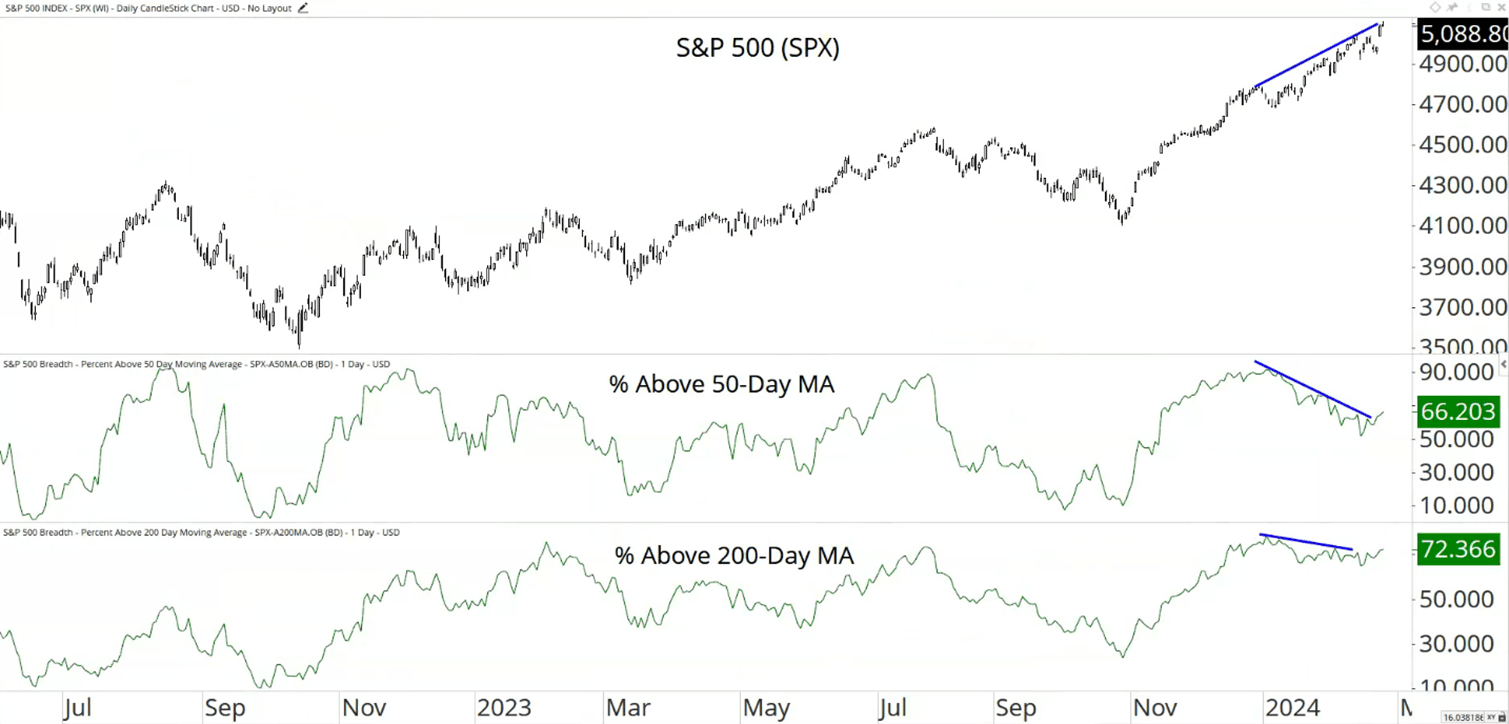
Another method that we like to use when studying market breadth is to measure the percentage of stocks that are trending above their respective moving averages. We commonly use the 50-day as a shorter-term average and the 200-day as a longer-term average. Simply put, the more stocks that are above their average, the healthier the trend.
At the time of this writing, you can see that both breadth indicators have a negative divergence. The S&P 500 is trending upwards to new highs, but the number of stocks that are above their 50 and 200-day averages is falling, which suggests that fewer and fewer stocks are participating in this rally.
It’s important to understand that divergences are a condition, and not necessarily a signal. A divergence doesn’t mean that you should go and sell your stocks, however it does suggest that probabilities are starting to shift. As market breadth begins to weaken, the risk/reward ratio starts to deteriorate. With this in mind, it gives us a reason to “take our foot off the gas” for a moment and exercise caution when putting new capital to work. For shorter-term traders, this kind of environment may offer a good opportunity to take profits into strength.
Source: Optuma
* * as at February 25th, 2024
So, the next time you’re analyzing the markets, don’t forget to take a closer look at market breadth – it just might be the missing piece of the puzzle!
This Month in Innovation [by Conor White]
Gene Therapy Allows an 11-Year-Old Boy to Hear for the First Time.
OpenAI CEO, Sam Altman, Seeks to Raise Billions for Network of AI Chip Factories.
Elon Musk’s Neuralink brain chip implanted in first human.AI Aids in Early Ovarian Cancer Diagnosis Development.
Crooks Stole $25.5 Million from a Multinational Firm Using a “Deepfake” Video Call.
OpenAI teases “Sora”, its new text-to-video AI model.
One UPtrend, One DOWNtrend [by David Cox]
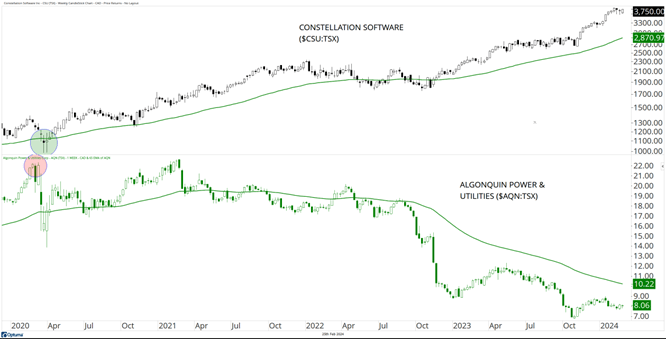
This month, let’s check on a couple of Canadian equities and two stocks from the S&P/TSX 60, which is essentially the large-cap index of the biggest publicly listed companies in Canada. Constellation Software ($CSU:TSX) is a stock from our #Insync universe and one that has been in a long-term trend of relative outperformance vs. the S&P 500. Sure, it’s technology, which has been strong as a sector, but if we accept that stock prices reflect not only fundamentals of a given business, but the underlying conviction, beliefs, forecasts and expectations of a company, a rising share price (especially one that has been rising for many years) is the biggest vote of confidence that investors can ask for.
Contrast that strong uptrend with Algonquin Power ($AQN:TSX), a $5.5 billion company that has been troubled since the #COVID crash. In fact, if you look closely (I added circles to make it easier for you), Constellation Software bottomed during the COVID crash and Algonquin Power topped out. I’d say Algonquin’s ugly trend can be partly blamed on the move higher in interest rates (which doesn’t tend to help out dividend stocks), but also on Algonquin’s clean-energy focus (while governments can tell us green energy is the way of the future, the market is suggesting that making profits and productively using capital isn’t quite so simple) and then sure, it’s a utility after all, so as a group, the sector has been VERY weak on both sides of the border, and globally. Again, this makes sense if we can acknowledge the environment we’re in. Nothing to do but understand that trends exist, understand they can continue for long periods of time, understand that being on the right side of trends makes more sense than the wrong side, and that the market knows more than you and I. The back of the room test works, and we’ll keep applying it.
Source: Optuma
* * as at February 23rd, 2024
Sharing Our Tools of the Trade [by David Cox]
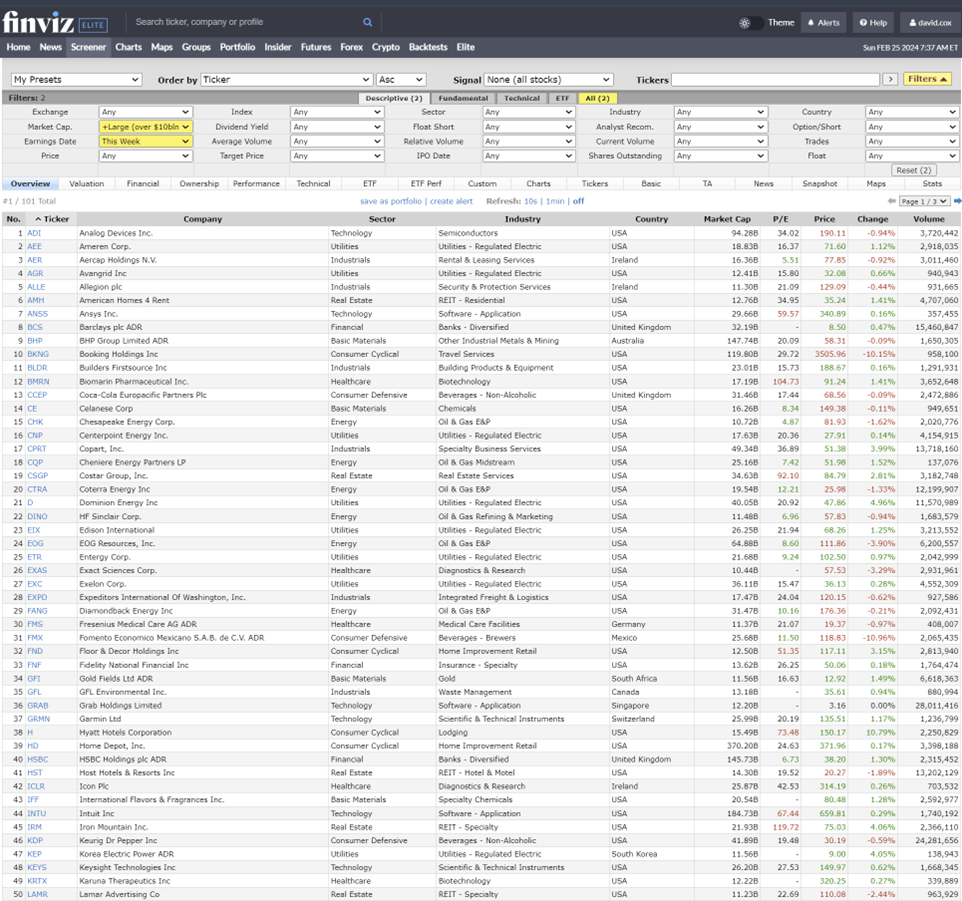
There are many who have discovered the powerful website of www.finviz.com. I’ve been a paid subscriber for years, which allows for me to store lists and apply and look at short-term charts of baskets of said securities with ease. Sorting to find out which stocks in my basket are in an index, or which S&P 500 stocks are reporting earnings this week, all are possible with a click or two of the various fields. In terms of understanding market health, and breadth more importantly, I like to check each day how many large-cap stocks hit new 52-week highs and how many of the same stocks hit 52-week lows. Finviz makes it a simple exercise.
Even for non-subscribers, I’d encourage those of you that aren’t familiar to take a look at the possibilities. Other observations that it helps me make are digging into how many stocks are up on the year or down, how many stocks have moved up or down by a significant percentage and each time the results are shown, they can be charted as a group.
Source: Marketsmith
* * as at February 23rd, 2024
We Like Fundamentals Too! [by David Cox]
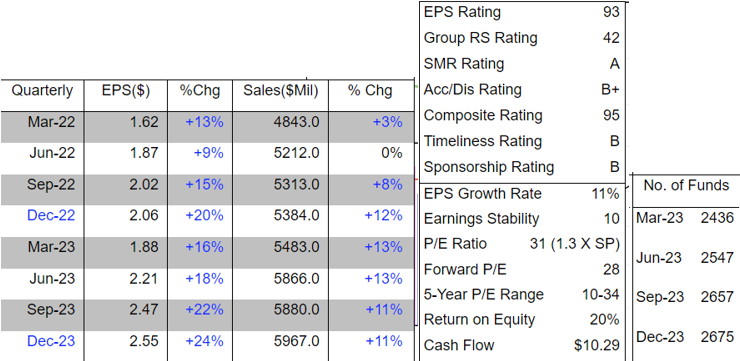
Although many (of you) have heard me quick to suggest that charts and the technicals matter (much) more than the fundamentals, at times, I feel guilty in perhaps being too quick to acknowledge parts of my thought process and suggesting that fundamentals are seemingly of distant importance. But truthfully, any long-term leading stock, you know, the ones that have a long history of outperforming the market relatively (just like that #INsync universe I keep referring to) has fundamentals and some kind of product or service that their clients must appreciate. Eaton Corp is a mega-cap $114 billion industrial company based in Ireland and the chart speaks for itself. But so do the fundamentals. Look below and while +10% year-on-year growth in sales isn’t as high as let’s say cyber-security, it’s a pretty steady growth rate, and a rate that many businesses would love to see. But look at the earnings growth (left column below) – even greater. This implies that while Eaton’s sales are growing, their bottom line earnings are growing even more so, which to me means the company is executing well and making good business decisions. This is also another one of the “4 quarters rising stocks”, which you’ve heard we say we like because that means more and more institutions are coming into the stock, and it’s those institutions which help us understand the demand and supply puzzle.
Source: MarketSmith
* * as at February 23rd, 2024
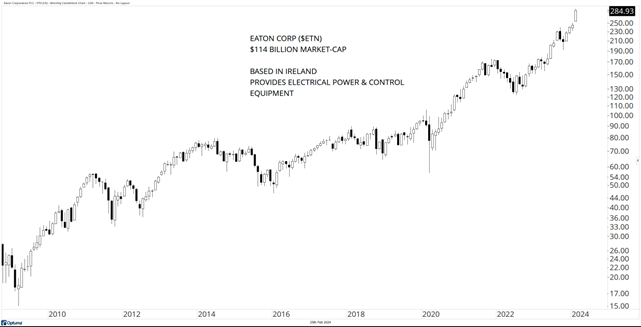
Here’s a 15-year chart of Eaton ($ETN) with monthly candlestocks (smooth out all those days AND weeks) and if you’ve read this far, you’ve already seen enough stock charts to know that it’s lower left to upper right uptrend. The market likes the fundamentals.
Source: Optuma
* * as at February 23rd, 2024
Chart of the Month [by David Cox]
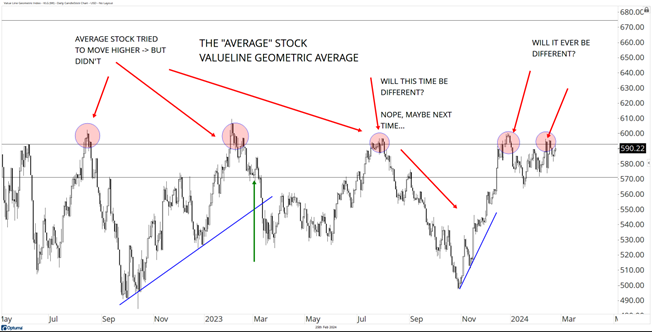
Although you’ve heard me say month after month that the U.S. market has been in an uptrend, let me complicate your understanding one bit. You see, the S&P 500 is a capitalization weighted index and its large constituents have no doubt been adding considerably to its progress (do NOT take this to mean the whole market is being driven by the largest 5-8 stocks since the October, 2022 lows, it’s simply not the case), but it is “only” 500 companies. I like to look at bigger indices, too, like the Russell 1000 (yes, you’re right, it contains a thousand stocks), the Russell 2000 small-caps (2000 stocks!) or the Russell 3000 (guess how many it has?).
The Value Line Geometric average has been around for a long time and instead of capitalization (size) weightings, where the big stocks can disproportionately impact and move the market, this average is geometrically linked returns, which is to say it’s more equal weighted without a stock or three that dominates. And what do we see here in the past couple of years? A still stuck in the range average that is NOT going up. It’s not going down either, but it’s not going up. So this means the “average” stock still isn’t doing very well, but that’s okay isn’t it? I mean who wants to own average stocks? Shouldn’t we want to own the best ones? The strongest ones? The ones that add value to the bottom line of our retirement and investment accounts? I’d say, yes! BUT, it would be nice to see this index break out some day in the near future and it would be a major signal for stocks, suggesting that a much broader basket of all shapes and sizes were being bid up by investors and it would make investing easier for most. But, it’s not supposed to be easy, is it? I don’t think so, but then again, that’s what we take on. The navigation of risks and opportunities for our clients and the pursuit of risk-adjusted returns. We want our process to be capable of adjusting strategically, to changing market conditions, and that it is.
Source: Optuma
* * as at February 23rd, 2024
Social Media and Our Website [by David Cox]
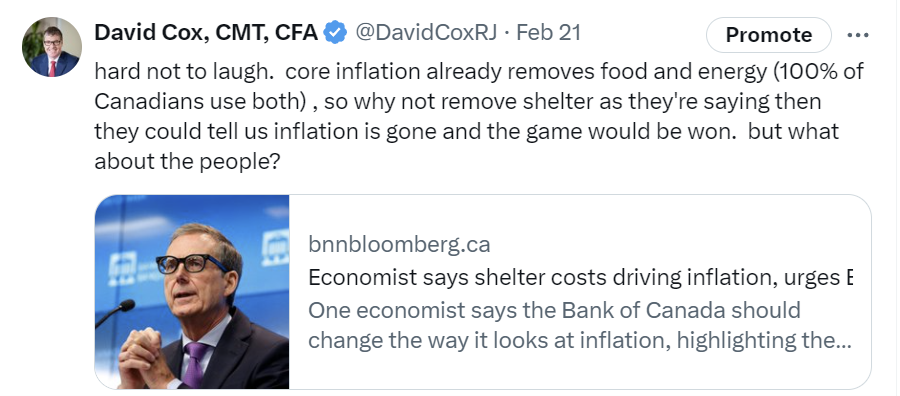
I have to say that there are so many things these days that in many ways strike me as utterly absurd examples of how the system (that includes the government, the central bank, the financial institutions and the media) conspire together to tell us what and how to think, and this recent article was just that and more. We all know the prices we pay for goods has gone up a lot in recent years. And you should know that even IF, the Bank of Canada (or the Federal Reserve/ECB/etc.) were to meet their inflation targets, rising prices are still the goal. Just not the pace of rises we’ve had in recent years. But now, we see the Bank of Canada not only contemplating, but suggesting that the reason inflation is still above target is because housing/rental costs are high and if they would exclude it, all would be good. And a couple of the bank economists are willing to tout the thought.
It wouldn’t be the first time they’ve played with the calculations or the formulae (and it likely won’t be the last). But imagine making a change behind the scenes and then reporting to all taxpayers that inflation is gone and prices aren’t going higher? Would you believe them? Or would you trust your own judgement? Your own spending habits? I try to point out folly when I see it and I sure thought this counted this month.
Upcoming Dates, Seminars, and Announcements [by David Cox]
What: Raymond James Portfolio Manager Conference
Where: Calgary, AB
When: April 8-10, 2024
Who: I will be attending.
What: Bitcoin 2024 Conference
Where: Nashville, TN
When: July 25-27, 2024
Who: I’m very excited to check out this growing event!
I hope you’ve found something to enjoy, laugh about or learn from this month, and thanks for reading!
Sincerely,
David Cox, CFA, CMT, FMA, FCSI, BMath
Senior Portfolio Manager, Wealth Advisor
Raymond James Ltd.
Phone: 519.883.6031
Unit 1 – 595 Parkside Drive | Waterloo, ON | N2L 0C7
david.cox@raymondjames.ca
www.financiallyinsync.com
![]() @DavidCoxRJ
@DavidCoxRJ
Disclaimer: Information in this article is from sources believed to be reliable, however, we cannot represent that it is accurate or complete. It is provided as a general source of information and should not be considered personal investment advice or solicitation to buy or sell securities. The views are those of the author, Financially INsync Team, and not necessarily those of Raymond James Ltd. Investors considering any investment should consult with their Investment Advisor to ensure that it is suitable for the investor’s circumstances and risk tolerance before making any investment decision. Statistics, factual data and other information are from sources believed to be reliable but accuracy cannot be guaranteed. It is furnished on the basis and understanding that Raymond James Ltd. is to be under no liability whatsoever in respect thereof. It is for information purposes only and is not to be construed as an offer or solicitation for the sale or purchase of securities.
Raymond James Ltd. is a Member Canadian Investor Protection Fund.
Raymond James (USA) Ltd. (RJLU) advisors may only conduct business with residents of the states and/or jurisdictions for which they are properly registered. Raymond James (USA) Ltd., member FINRA/SIPC.