Quarterly Strategic Review - 2nd Quarter (Apr-Jun, 2025)
Second Quarter 2025 – July, 2025 – A Buying Opportunity It Was!
I’ve long since employed a growing list of tools, models and charts that help us make the decisions that feed into the portfolio management process – assisting with both timing in the pursuit of returns and the management of risk. Typically, we see oversold conditions only once per year (like we had in April, 2025) and when those oversold conditions happen in the face of widespread and almost unanimous fear (they did in ’25), as investors, it tends to pay greater dividends to contemplate taking the other side. The good news is that given the increased management efficiency afforded by the #AllINsync pool, we were able to ensure we didn’t get left behind (or at the bottom) waiting for the market to ring a bell to suggest the bottom was in – because as you know, there is no such bell.
But, But, But…
You must remember (and I often remind myself) that the news is a lagging indicator, and while the media like to try to explain what has happened (and the why!), pitching their words to willing ears as what is, or what will, happen. This is where the real issue comes in.
Either way, we saw every buy signal from every model that I have created fire, some earlier, some later, and now, we are sitting in an uptrend with the stock markets having recently reached all-time highs (at least the North American ones).
At every low (pretty sure about this) in stocks over the 22+ years that I’ve been at the helm, there were always reasons to be fearful. The reasons are often different, but they rhyme. At the risk of always repeating things too much, fear is a powerful emotion (more powerful than greed), and so markets fall (and tend to fall more quickly than they rise). So, when fear is in the streets, know that the reasons for your fear are not novel. They’re well-known fears which have already been priced in by the market. But markets are forward looking, hence, they bottom before the better news arrives.
The Markets
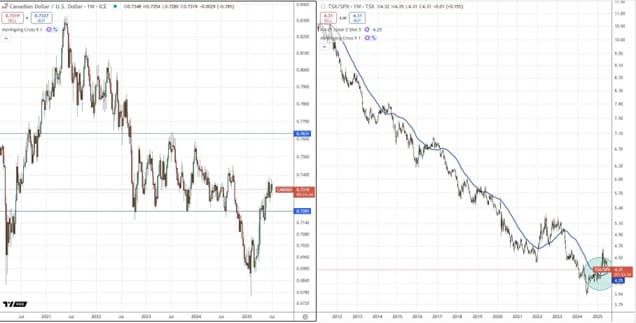
While the foreign markets (including our own domestic Canadian market) have performed admirably in recent months, I continue to be somewhat skeptical of their staying power and question if this is truly a new legitimate trend of outperformance. Forgive me for my skepticism but it’s been 16-years since the relative peak of Canadian stocks vs. U.S. stocks. That said, I also consider short-term bottoms important periods to adjust (and consider rotating in this case) because long-term trend change doesn’t happen without the short-term, followed by the intermediate term confirmation, first. In the chart below, you can see that the TSX vs. S&P 500 remains in a big-picture downtrend (right side of chart) despite the stronger relative performance in the last year (green circle). To summarize it simply, the fact remains that key areas of technology, like semiconductors and artificial intelligence don’t exist on the Toronto stock market and these technology and mobile communication trends are only increasing in the world around us (whether or not you or I have the latest gadgets).
In February, I also pointed out the bottom in the Canadian, which served to add to our reasons to adapt (and adapt quickly) even as scary headlines occurred in the winter (left side of chart). While indeed the Canadian dollar bottomed in February, moving from
~68 cents to ~73 cents, it still doesn’t change the downtrend (left side of chart).
Left: Canadian vs. U.S. dollar ($CADUSD)
Right: Toronto stock market $TSX vs. U.S. S&P 500 stock market $SPX
Our Strategy & Our Allocation
Most of our Canadian clients, at least the ones living in Canada, have exposure in one way or another to the #AllINsync pool. And remember, that applies to aggressive clients and conservative clients alike! Those that are more aggressive, tend to also have some additional exposure to the “INvertigo” type stocks, which are the more volatile growth- oriented stocks that break out of bases. As is/was typical in weak markets (i.e., ‘21/’22), these stocks get hammered and turn south quickly which results in losses and downside volatility and breakouts fail with a high probability making the style of investing a costly one. That said, when the market is acting bullishly, they perform quite well, though have more ground to make up.
We continue to be well exposed to both gold and silver bullion and they comprise approximately ~11.2% of the overall holdings in #AllINsync. Many of you also have additional exposure to bullion outside of the AllINsync (RJI237), in your accounts, and this continues to make sense from both the point of view of their continued uptrends and their contribution to more efficient risk-adjusted returns that diversify other equity related exposure.
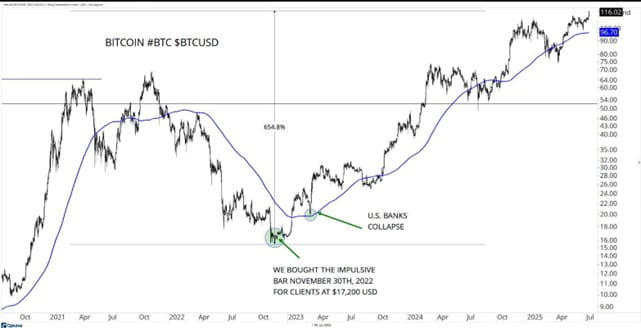
Most of you also have exposure to Bitcoin (BTCC:TSX) and/or related cryptocurrency/mining ETFs (BITQ:US/BITS:US) which have been strong performers, though (very frustratingly!) remain restricted in all forms in your account. We can continue holding, but we cannot add to these positions. If they’re sold, they cannot be bought back. I’m not content to have to continue to share this with you, but the facts are the facts.
Those of you that have been clients since before we moved to Raymond James bought Bitcoin on November 30th, 2022, and it’s up a lot since then. Here’s the updated chart. We bought in at the green circle at the low and have held ever since. Bitcoin also offers diversifying properties, which include a low correlation to equities and has been a significant contributor to most of your portfolios. I sincerely hope that at some point in the near future, these assets are no longer restricted and constrained as they are.
Given everything at hand, we have had a rather wild past year in our investment portfolios as you will see in your attached household performance report. Most of you have had a very strong recent quarter as we rebounded in healthy fashion. However, on a 6-month (year-to-date) basis made no progress (i.e., a weak period preceded the strong period) and when you extend it out further, our last 12 months, too, has been quite weak and further yet, as earlier returns are included, portfolios look healthy again. There can be dramatic changes in short-term returns (yes, 1–2 year returns are still considered short) given the swings we can at times experience and as the impact of strong (or weak!) periods come and go in the reported time frames.
Bottom Line: the U.S. market now has a positive gain this year after falling -21.3% from peak to trough in March/April, but in Canadian dollar terms it is far weaker. To put it more clearly, the S&P 500 is +6.8% year-to-date (to July 10th as I write this) but in Canadian dollar terms it’s only +1.4% (remember, the Canadian dollar is +5.3% this year, which directly harms our foreign position values (if we’re not careful).
A Few Reminders & Closing Thoughts
As you hopefully know by now, Kieran O’Donnell and Avery Kelly have joined me here in the office on Financially INsync and I continue to be over the moon excited! There are so many plans and exciting developments beyond the scenes to come as we continue this journey together and I’d like to again emphasize how thankful I am, for each and every one of you and the trust you have put in me (and my team) over the years.
I have a very busy travel calendar in the coming months littered with vacation to DC/Maryland/Pennsylvania and New York, then followed up by Italy, Malaysia, Dubai, Montreal and Vancouver (& Rossland!) all before 2025 closes, my goodness it sounds busy! I hope this quarterly review has been helpful in some way or manner!
Your feedback, questions and/or comments are always welcome!
Sincerely,
Disclaimer: Information in this article is from sources believed to be reliable, however, we cannot represent that it is accurate or complete. It is provided as a general source of information and should not be considered personal investment advice or solicitation to buy or sell securities. The views are those of the author, Financially INsync Team, and not necessarily those of Raymond James Ltd. Investors considering any investment should consult with their Investment Advisor to ensure that it is suitable for the investor’s circumstances and risk tolerance before making any investment decision. Statistics, factual data and other information are from sources believed to be reliable, but accuracy cannot be guaranteed. It is furnished on the basis and understanding that Raymond James Ltd. is to be under no liability whatsoever in respect thereof. It is for information purposes only and is not to be construed as an offer or solicitation for the sale or purchase of securities.
Raymond James Ltd. is a Member Canadian Investor Protection Fund.
Raymond James (USA) Ltd. (RJLU) advisors may only conduct business with residents of the states and/or jurisdictions for which they are properly registered. Raymond James (USA) Ltd., member FINRA/SIPC.